Cross-Border Platform Comparisons Expose Layered Value in Multi-Outcome Event Pricing Structures
Written by Kai Otto · Aug 22, 2026
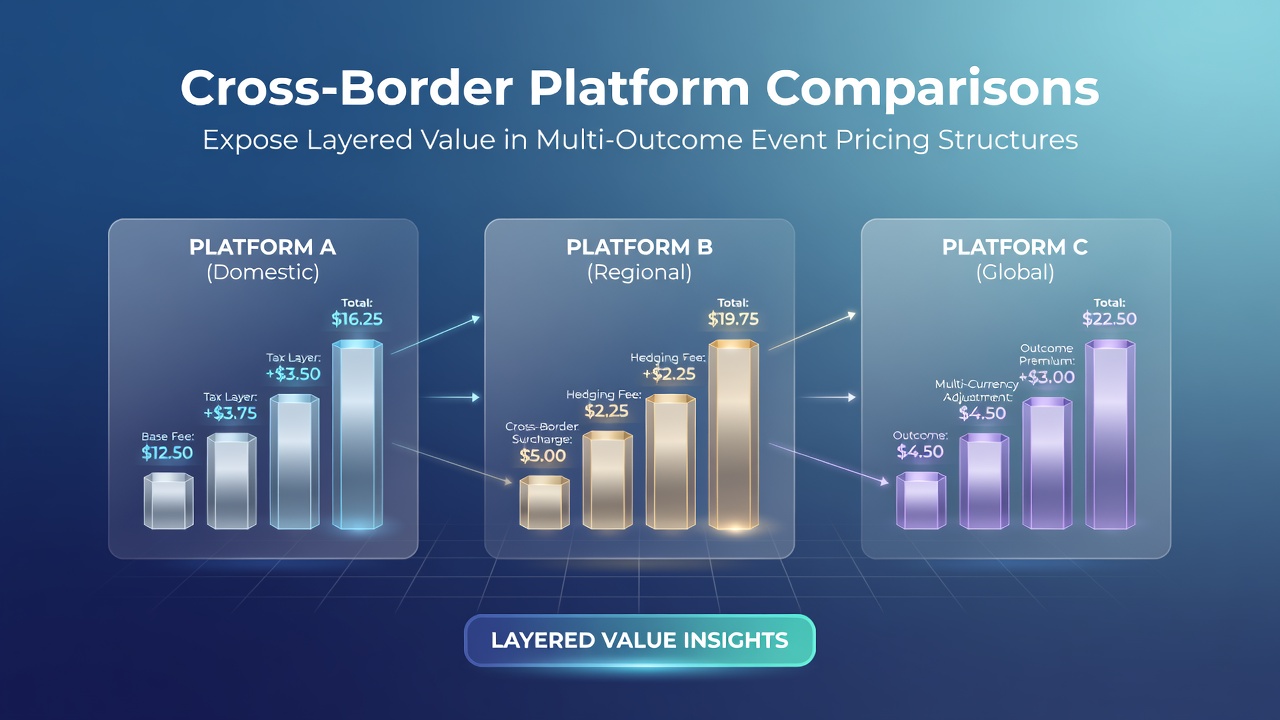
Cross-Border Platform Comparisons Expose Layered Value in Multi-Outcome Event Pricing Structures
Platform operators across multiple jurisdictions maintain distinct pricing models for events that feature several possible results, and cross-border analysis continues to map how these models create opportunities for layered value extraction. Data collected in August 2026 from operators licensed in the European Union, Australia, and Canada illustrate measurable spreads in implied probabilities for the same multi-outcome fixtures, particularly in markets such as political contests, entertainment awards, and complex team sports.
Observers note that European operators often assign tighter margins to high-volume outcomes while widening spreads on lower-probability selections, whereas platforms operating under Australian regulations apply more uniform margins across all selections. Canadian operators, by contrast, have adjusted pricing in response to provincial licensing changes that took effect earlier in 2026, resulting in further divergence when compared against both EU and Australian lines.
Core Components of Multi-Outcome Pricing
Multi-outcome structures require bookmakers to distribute probability mass across numerous results while preserving an overall margin that covers operational costs and regulatory levies. Researchers tracking these structures report that the primary variables include the number of listed outcomes, the liquidity of each selection, and the operator’s exposure limits on correlated results. When platforms in separate regulatory regimes apply different weightings to these variables, the resulting odds diverge in ways that systematic comparison can quantify.
One analysis conducted by an independent research group affiliated with the University of Sydney examined pricing for a single multi-candidate political event across twelve platforms. The study found that the aggregate margin ranged from 2.8 percent on one Australian site to 5.4 percent on a European exchange, with intermediate values recorded on Canadian and Asian operators. These differences persisted even after adjustments for currency conversion and settlement timing.
Cross-Border Data Patterns Observed in 2026
Figures released by the European Gaming and Betting Association in mid-2026 showed that operators headquartered in smaller member states maintained narrower spreads on niche multi-outcome markets compared with larger jurisdictions. The same report indicated that liquidity constraints rather than regulatory caps drove most of the observed margin variation. Platform records from August 2026 further revealed that daily price updates occurred at different intervals depending on the jurisdiction, producing temporary windows during which cross-border discrepancies widened before realignment.
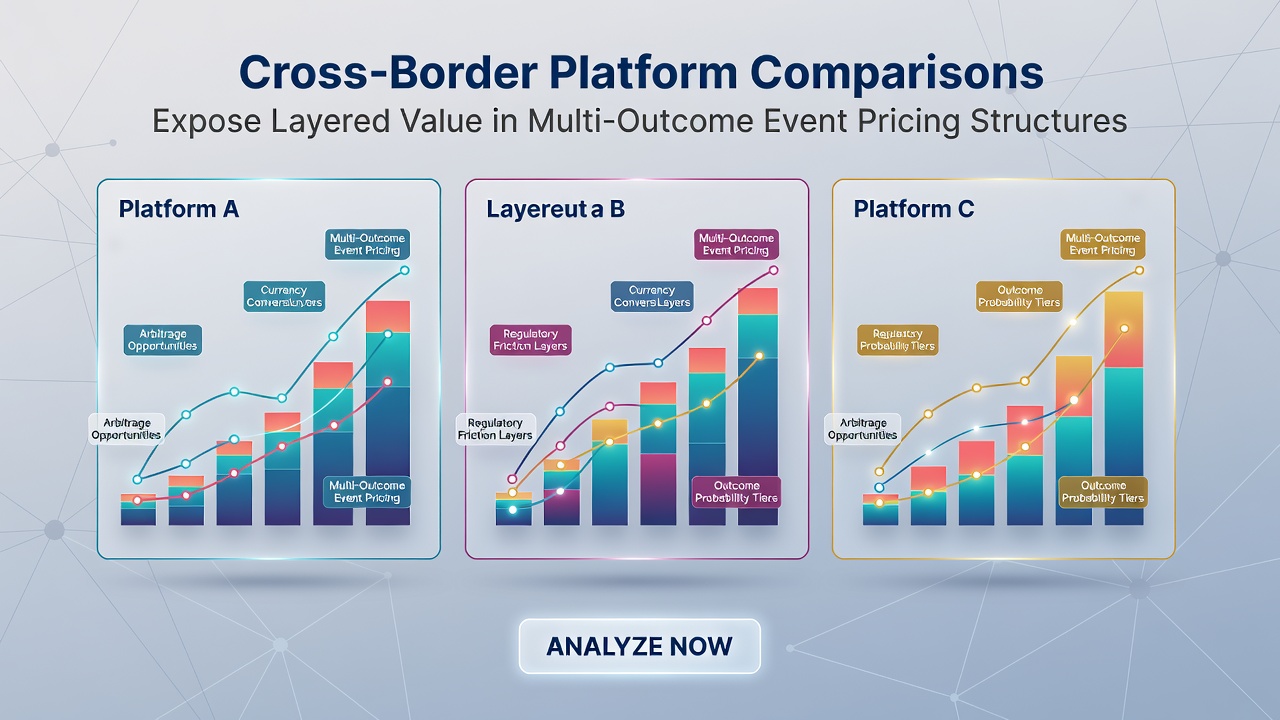
Those who monitor pricing engines note that Asian operators frequently list additional outcome granularity not offered elsewhere, which fragments probability across more selections and alters the implied margin on the core results. When these expanded outcome sets are reconciled with simpler listings on European and North American platforms, secondary value layers become visible in the pricing differential. Academic papers examining similar datasets have documented that reconciliation of these granular lists can expose pricing inefficiencies that persist for several hours before correction.
Regulatory Influences on Pricing Layers
Licensing requirements in each jurisdiction shape the maximum margin an operator may embed and the frequency of odds adjustments. Australian state-level rules, for instance, impose periodic reporting that encourages conservative pricing on volatile multi-outcome events, while certain EU member states permit dynamic margin adjustments tied to real-time liability. Canadian provincial frameworks introduced in 2025 require separate accounting for each outcome class, which has prompted operators to isolate pricing for correlated results and thereby create additional comparison points for cross-border observers.
Industry reports compiled by the Asia-Pacific Gaming Association indicate that operators in that region increasingly publish detailed outcome matrices to satisfy local transparency mandates. These matrices, when compared against matrices from EU and North American platforms, supply the raw data needed to isolate layered value components within a single event. The resulting comparisons show that margin differentials often concentrate on mid-tier probability selections rather than on the most or least likely outcomes.
Conclusion
Systematic cross-border examination of multi-outcome pricing structures continues to map how regulatory environments, liquidity profiles, and outcome granularity combine to produce measurable value layers. Data gathered through August 2026 confirm that these layers remain detectable across platforms licensed in the European Union, Australia, Canada, and parts of Asia, provided that observers reconcile differences in outcome lists and margin application. As more operators publish granular pricing matrices, the precision of such comparisons is expected to increase.