Lower-Tier Soccer Handicap Line Discrepancies: Analytical Techniques for Spotting Platform-Based Edges
Written by Iris Beck · Aug 25, 2026
Lower-Tier Soccer Handicap Line Discrepancies: Analytical Techniques for Spotting Platform-Based Edges
Lower-tier soccer leagues present distinct challenges for handicap line analysis because data sets remain thinner and goal distributions shift more dramatically than in top divisions; observers note that bookmakers adjust lines using limited historical samples which creates measurable variances across platforms. Computation methods rely on aggregating odds feeds from several operators then applying statistical filters to isolate discrepancies that exceed normal market noise. Data from European lower divisions shows these variances appear most often in matches involving newly promoted sides or teams with recent managerial changes where public information lags behind real performance shifts.
Core Computation Frameworks
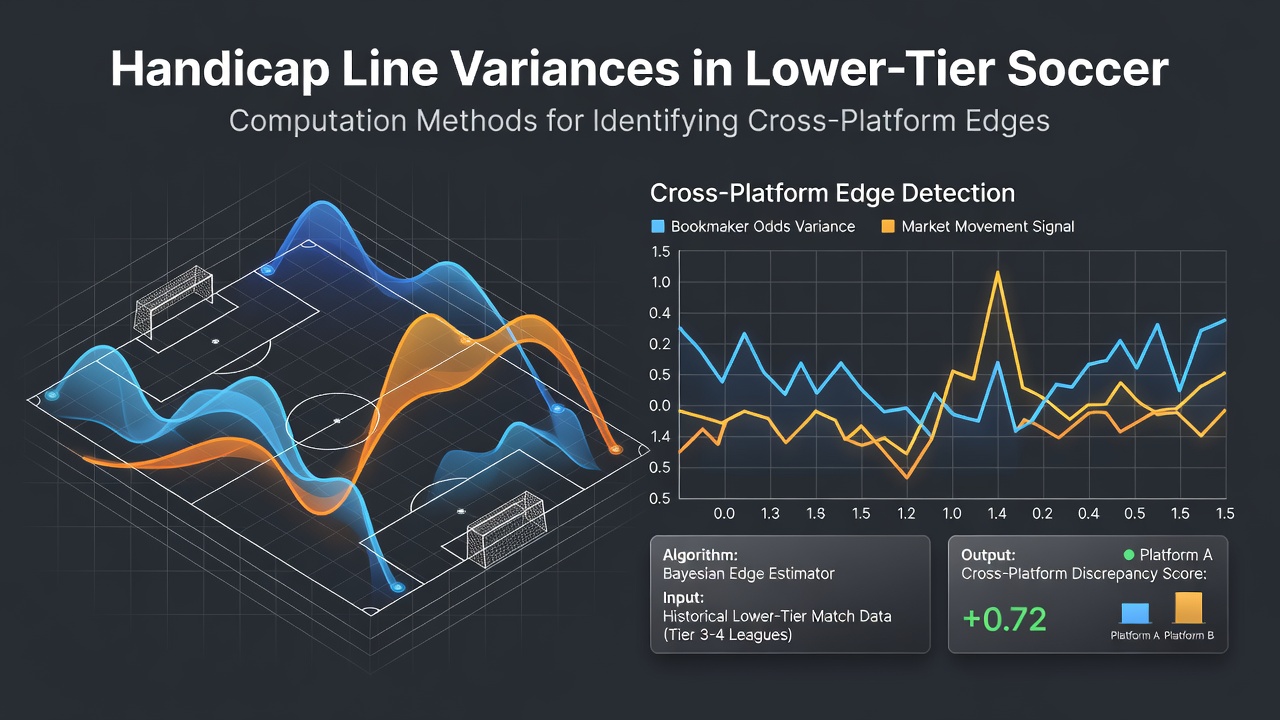
Analysts begin with expected goal models calibrated specifically for leagues such as England's National League or Spain's Segunda División B, adjusting Poisson parameters for lower average scoring rates and higher draw frequencies; these models generate baseline handicap probabilities that serve as reference points. Variance detection then proceeds through pairwise comparison scripts that calculate the absolute difference in implied probabilities between any two platforms for the same handicap line, flagging instances where the gap exceeds a threshold derived from historical volatility data. Researchers apply Monte Carlo simulations to account for uncertainty in lower-league results, running thousands of iterations that incorporate team strength ratings adjusted for travel distance and fixture congestion common in regional competitions.
Data Aggregation and Filtering Steps
Cross-platform edge identification requires simultaneous collection of handicap lines from multiple sources followed by normalization to a common decimal format; this step removes presentation differences that otherwise obscure true variances. Filtering algorithms discard lines where liquidity indicators fall below set levels because thin markets produce artificial spreads unrelated to fundamental mismatches. One study revealed that incorporating real-time team news feeds improves detection accuracy by reducing false positives stemming from outdated squad information, particularly in August 2026 when summer transfer windows close and lower-tier clubs finalize rosters late.
Statistical Measures Applied to Handicap Lines
Standard deviation calculations on historical handicap outcomes help set confidence intervals, while regression analysis identifies which factors most strongly correlate with line movements in specific leagues. Observers note that lower-tier matches exhibit wider outcome variance due to inconsistent officiating and pitch conditions, prompting some computation systems to widen tolerance bands before declaring an edge. Those who've studied this process often discover that combining Asian handicap data with European handicap lines from separate platforms yields additional signals because the two formats weight draw outcomes differently.

Turnout patterns from the Australian Transaction Reports and Analysis Centre indicate rising interest in automated monitoring tools among professional syndicates targeting secondary soccer markets. These tools routinely export flagged discrepancies into spreadsheets that calculate required stake sizes according to each platform's margin and maximum bet limits.
Practical Implementation Considerations
Execution speed matters because handicap lines in lower-tier fixtures adjust rapidly once early money appears; scripts therefore prioritize low-latency API connections over manual refresh cycles. Teams monitoring these markets also track platform-specific restrictions on stake reductions that can nullify an identified edge before placement completes. Evidence suggests integrating weather and travel data into the core model further refines projections for leagues where matches occur on exposed grounds with limited drainage.
Conclusion
Systematic computation of handicap line variances across platforms supplies a repeatable framework for locating edges in lower-tier soccer, relying on calibrated statistical models, real-time data aggregation, and disciplined filtering rather than anecdotal observation. As August 2026 seasons progress, continued refinement of these methods through additional league-specific data should sustain their utility for those maintaining disciplined monitoring routines.