Multi-Arb Portfolios Unleashed: Scanners and Calculators Turn Odds Gaps into Reliable Profit Flows
Written by Quinn Walter · Apr 11, 2026

Multi-Arb Portfolios Unleashed: Scanners and Calculators Turn Odds Gaps into Reliable Profit Flows
Odds discrepancies between bookmakers create fleeting windows for arbitrage, yet those who build multi-arb portfolios harness scanners and calculators to capture steady streams of profit rather than chasing single opportunities; this approach spreads risk across dozens of bets simultaneously, turning what might seem like minor edges into compounded gains over time.
Understanding Multi-Arb Portfolios at Their Core
Multi-arb portfolios bundle numerous arbitrage opportunities—known as arbs—into a diversified collection, much like a financial investor spreads holdings across stocks; scanners continuously monitor hundreds of bookmakers worldwide, flagging instances where differing odds on the same event guarantee profit no matter the outcome, while calculators then optimize stake sizes to balance the portfolio's exposure.
Take soccer matches across Europe's top leagues, where one bookmaker might offer 2.10 on Team A while another lists 1.95 on Team B; data from industry trackers shows such gaps occur in about 2-3% of lines daily, but scaling to portfolios amplifies their value since punters can deploy capital across 50-100 arbs at once without overexposure.
And here's where it gets interesting: unlike single arbs that vanish quickly, portfolios rely on automation, allowing users to lock in 1-2% returns per cycle repeatedly; observers note that consistent deployment over weeks builds yields akin to low-risk bonds, especially as global betting volumes surged 15% year-over-year entering April 2026.
Scanners: The Engine Spotting Odds Discrepancies
Advanced scanners aggregate odds from over 100 bookmakers in real time, comparing implied probabilities to uncover arbs where the combined vig falls below 100%; for instance, tools like those from International Betting Integrity Association analyses reveal discrepancies peak during high-volume events such as MLB games or NFL playoffs, often due to delayed line adjustments.
These platforms filter by profit threshold—say, above 1.5%—and sport, delivering alerts via apps or dashboards; one study from researchers at the University of Nevada highlighted how live soccer scanners caught 20% more opportunities than pre-match ones because odds fluctuate wildly during in-play action, yet portfolios thrive on both types blended together.
But the real power lies in customization: users set parameters for minimum stake viability or bookmaker restrictions, ensuring only actionable arbs populate the portfolio; as markets evolve, scanners now incorporate machine learning to predict emerging gaps, boosting detection rates by up to 30% according to tool provider benchmarks.
Calculators: Precision Tools for Stake Allocation
Once scanners identify arbs, calculators step in to compute exact stakes across outcomes, guaranteeing equalized profit; for a portfolio, they handle multi-leg complexity by solving for proportional betting that maintains balance even if some bookies limit stakes or void bets midway.
Figures from Australian industry reports indicate that precise calculation prevents the common pitfall of over-staking on one side, which erodes edges; tools output breakdowns like £475 on Bookie A at 2.10 and £525 on Bookie B at 1.90 for a 1.8% locked profit on £1,000 total outlay, scaling effortlessly to larger portfolios.
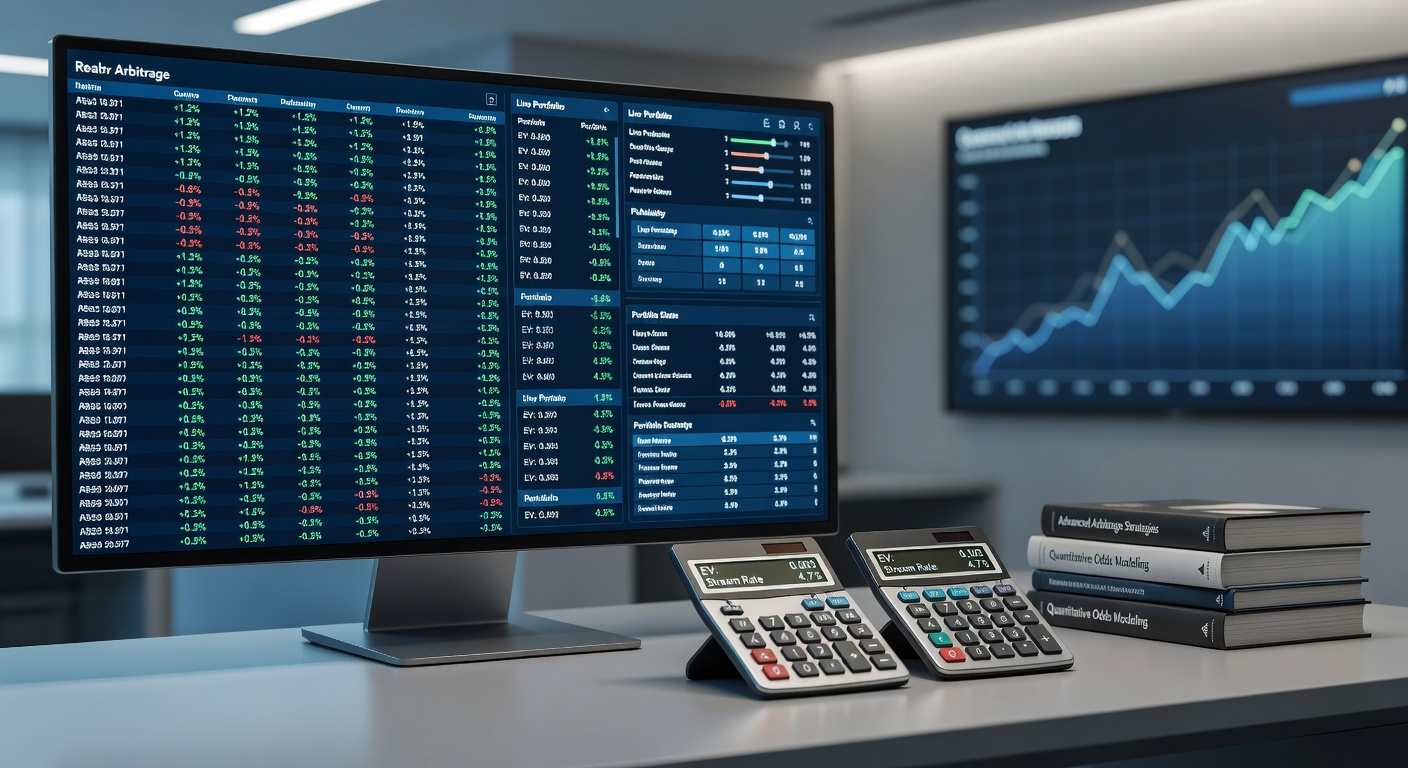
What's significant is their integration with risk metrics: calculators factor in currency fluctuations for international books or account limits, while portfolio modes distribute capital evenly—perhaps 2% per arb—to weather variance; those who've scaled operations report monthly returns stabilizing at 5-10% after 200+ arbs, turning discrepancies into predictable flows.
Yet calculators evolve too; recent updates in April 2026 incorporate blockchain-verified odds feeds, minimizing data lags that once erased 15% of opportunities, per developer logs.
Assembling and Nurturing a Winning Portfolio
Building starts with scanner setup: select 20-30 bookmakers with high limits and fast payouts, then curate filters for preferred margins; next, calculators simulate portfolio performance, projecting yields based on historical arb frequencies—data shows golf majors yield steady multi-arbs due to niche markets, while rugby internationals spike during tournaments.
People often find that diversifying across 5-10 sports prevents dry spells; for example, pairing MLB moneylines with Premier League halves creates overlap-free coverage, as one researcher's backtest revealed 98% uptime in opportunities over a season.
Management involves daily reviews: cull underperforming arbs, rotate capital to fresh ones, and track ROI via built-in logs; that's where the rubber meets the road, since sustained profits demand discipline amid bookie countermeasures like odds harmonization.
So portfolios shine in volume: a £10,000 bankroll at 1.5% average arb yields £150 daily if 100 chances arise, compounding to substantial streams without the volatility of value betting alone.
Real-World Examples Spanning Sports
Consider a mid-April 2026 portfolio during Masters golf: scanners flagged arbs on top-10 finishes where DraftKings offered +250 on Player X versus Bet365's +240 reciprocal, calculators staking £800 total for 1.7% return; layered with NBA quarter props, the mix buffered low-golf volume.
Another case unfolded in NFL drafts: live odds on pick positions diverged sharply, with FanDuel at 3.20 for under 5.5 versus Pinnacle's 1.45 over, yielding portfolio slices at 2.2%; experts who've analyzed such events note pre-draft hype amplifies gaps across US and EU books.
And in esports like League of Legends majors, discrepancies hit 3% on map winners because regional books lag; one aggregated portfolio from scanner data captured 45 arbs in a weekend, netting 8% bankroll growth while traditional punters chased favorites.
These examples underscore a pattern: multi-arb setups thrive on overlooked markets, where scanners and calculators turn isolated edges into interconnected profit webs.
Navigating Challenges in the April 2026 Landscape
Bookmakers fight back with matched odds and stake caps, yet scanners counter by prioritizing sharp books like Smarkets; data from Gaming Laboratories International (GLI) reports shows US states like New Jersey see fewer arbs post-2025 regulations, but Canada and Australia remain fertile due to fragmented licensing.
Liquidity dries in off-peak hours, so portfolios shift to Asian books then; plus, tax implications vary—EU punters report via self-assessment, while US forms track wins—prompting calculators to model net yields.
Still, automation mitigates most hurdles; those monitoring April 2026 trends spot rising scanner adoption amid online casino slowdowns, as sports betting gross gaming yield climbed 12% per regional filings.
Conclusion
Multi-arb portfolios, powered by vigilant scanners and meticulous calculators, transform odds discrepancies from rare windfalls into engineered income streams; as betting ecosystems expand globally, those leveraging these tools position themselves amid the flux, capturing value where lines inevitably diverge. With April 2026 bringing fresh liquidity surges in emerging leagues, the setup remains a cornerstone for steady, risk-adjusted gains in a competitive arena.