Multiplayer Game Betting Lines: Calculators Uncovering Discrepancy-Driven Opportunities
Written by Iris Beck · Jul 9, 2026

Multiplayer Game Betting Lines: Calculators Uncovering Discrepancy-Driven Opportunities
Multiplayer game wagering has expanded rapidly as platforms host competitive matches in titles ranging from MOBAs to battle royales, and line variations between bookmakers create measurable gaps that specialized calculators detect in real time. These tools process odds from multiple operators simultaneously, flagging instances where implied probabilities diverge beyond standard margins, which allows systematic identification of potential edges without reliance on manual cross-checking.
Mechanics of Line Discrepancy Detection
Calculators aggregate live odds feeds and apply algorithms that compare decimal, fractional, and American formats across jurisdictions, converting them into normalized probabilities for direct evaluation. When one operator lists a team at 2.10 while another sets the same outcome at 1.95, the software computes the variance and signals whether the spread exceeds the combined bookmaker margins, enabling users to evaluate both arbitrage sequences and isolated value positions within seconds of each market update.
Operators adjust lines continuously based on betting volume, injury reports in esports rosters, and patch notes released by game developers, yet synchronization lags persist across regions because licensing requirements and risk models differ. Research from academic groups tracking digital wagering patterns shows that these timing differences generate recurring windows where calculators identify favorable alignments before markets converge.
Growth Patterns in Competitive Gaming Markets
Participation in sanctioned multiplayer tournaments reached new levels during the first half of 2026, with prize pools and viewership metrics driving increased bookmaker coverage for events in North America, Europe, and Asia-Pacific territories. Data compiled by industry monitoring organizations indicates that live in-play markets now account for a larger share of total handle than pre-match lines in several major titles, which amplifies the frequency of line movements that calculators monitor.
Regulatory filings from bodies such as the American Gaming Association document steady expansion in digital betting segments tied to interactive entertainment, while separate analyses from university research centers highlight how liquidity differences between smaller and larger operators sustain the very discrepancies that detection software targets. Observers tracking these flows note that July 2026 brought additional volatility as several game publishers issued mid-season balance updates, prompting rapid re-pricing across multiple platforms.
Integration With Broader Arbitrage and Value Strategies
Stake calculators designed for multiplayer lines often incorporate modules that layer single-event discrepancies with accumulator structures, calculating required stake distributions to lock returns when two or more correlated markets display opposing biases. This layered approach extends beyond simple two-way mismatches and includes three-way outcomes common in objective-based game modes where draw probabilities fluctuate during extended matches.
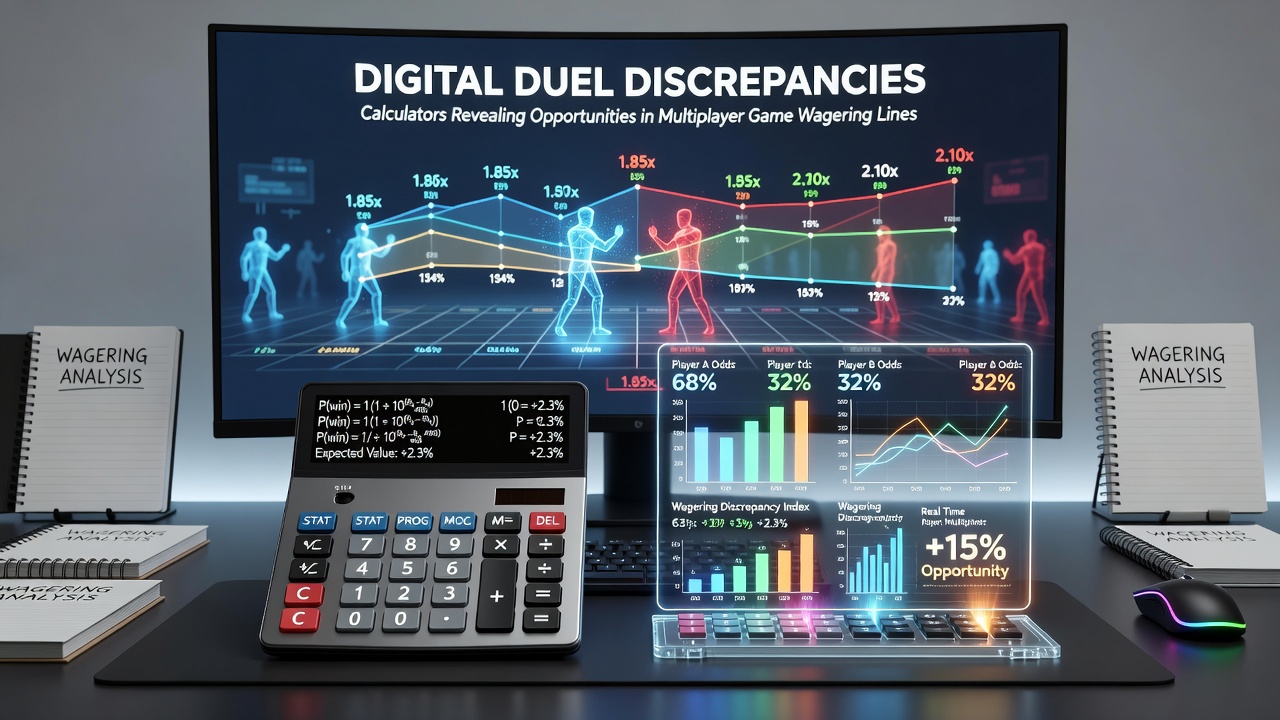
Those monitoring live feeds report that mid-match adjustments in resource accumulation or objective control frequently produce odds drifts that scanners capture faster than manual observation allows. One documented pattern involves resource-denial mechanics in strategy games where an early lead shifts implied win probabilities by several percentage points within minutes, creating windows where cross-bookmaker variance widens before operators align their risk exposure.
Regional Variations and Data Sources
European operators tend to post tighter margins on established esports leagues while North American and Australian platforms sometimes maintain wider spreads during off-peak hours, according to comparative studies released by international gaming research networks. These geographic differences compound when currency conversion and local tax structures enter the equation, further widening the numerical gaps that calculators quantify.
Industry reports from organizations such as the Esports Integrity Commission emphasize the importance of transparent odds sourcing, yet the same publications acknowledge that fragmented market structures continue to produce exploitable inconsistencies. Figures released in mid-2026 showed increased transaction volumes during major summer tournaments, correlating with higher detection rates for line discrepancies in the weeks following balance patches.
Practical Application in Live Markets
Users deploy these calculators alongside notification systems that alert when variance thresholds are met, allowing rapid placement across multiple accounts while liquidity remains available. The process requires verification that each outcome remains independent enough to satisfy settlement rules, particularly in matches where team substitutions or server issues can alter final results after initial lines are posted.
Case examples tracked by platform analytics teams illustrate sequences in which early-round underdogs attract disproportionate action on one site while the opposing side receives heavier support elsewhere, generating brief periods where combined implied probabilities fall below 100 percent. Such instances appear most often in best-of-three formats where map selection order introduces additional uncertainty factors that slower-moving books price differently.
Conclusion
Calculator-driven identification of wagering line discrepancies in multiplayer gaming continues to evolve alongside both technological feeds and regulatory frameworks across multiple regions. The documented patterns of variance, driven by timing lags, liquidity differences, and content updates from game developers, provide measurable data points that systematic tools convert into actionable comparisons. Ongoing monitoring of these markets through 2026 and beyond will likely reflect further refinements in how operators manage exposure while players and analysts track the resulting numerical gaps.